CHAPTER 4
Ecosystem Services
Gamze YÜCEL IŞILDAR & A. Çağlan GÜNAL
Contents
4.Ecosystem Services
The foods we eat, the air we breathe, the water we drink and the climate that makes our planet habitable all come from nature.
Yet, these are exceptional times in which nature is sending us a message. Nature is showing that we are on the verge of a breakdown. It’s time to wake up. To take notice. To reimagine our relationship with nature.
UNEP, World Environment Day, 2020
In spite of increasing public awareness and understanding the importance of the contribution of healthy ecosystems to human well-being in recent years; the degradation of ecosystems and loss of biodiversity still continue on a large scale. While people demanding more from the nature and overuse natural resources, destruction of ecosystems are increasing rapidly. In fact, ecosystems with high productivity are the guarantee of human safety with the services they provide. Healthy ecosystems are able to reduce risks and vulnerability where as poorly managed ecosystems may cause flood, decrease in crop quality, emergence of diseases like Covid 19 (Liu, 2005). Despite of this fact, knowledge of how ecosystems function, what are the types of ecosystems are, and how to manage them on a sustainable basis is lacking.
Mc Bride and Baldauf (2011) analyzed more than 1,000 ecologists and other environmental scientists on the ‘nature of ecological literacy’ and ‘how it may be achieved’. Results of this study indicated that, “ecosystem services (ES)” is one of the six common dimensions showing participants’ views for ecological literacy. ES framework allows the integration of multiple value realms; ecological, social, cultural and economic values, thus acknowledging the complexity of social-ecological systems in decision making (Martín-López et al, 2014). These values attributed to ecosystems, will affect people’s relations with ecosystems, their demands/preferences and how to interfere/benefit from ecosystem services. Improved knowledge to realize ecosystems and their benefits in terms of ecosystem services enriched with socio-ecological sytem approach will provide better perceptions and more sustainable ecosystem valuation and management. The value might be expressed in many different ways; ethically, economically, esthetically or other qualitative criteria. It is important to reveal mutual relationship with direct and indirect impacts, links between ecosystems and human wellbeing. Understanding the importance of the impacts of external pressures on ecosystems is a prerequisite for protection and conservation. People should understand the importance, necessity and value of ecosystem services so that they understand why they need to protect ecosystems and determine their priorities when deciding on land use or other similar projects in the balance of protection and use accordingly.
Along this line, the overall objective of this chapter is to improve the knowledge of “ecosystem services” (ES), their benefits and values to become “ecoliterate citizens”. To achieve this aim, following questions will be explained in this chapter.
- The interactions between different components of ecosystems and how they functions in relation to with each other and the role of biodiversity in terms of ES
- Typology of ES common to EU
- Anthropogenic impacts on ecosystems
- Anthropogenic impacts on provision of ES
- Impacts of spatial and temporal differences on demand from ES
- Mapping and integrated assessment of ES for objective valuation
- How to manage sustainably ES and biodiversity; effectiveness of “ecosystem service concept” in policy development.
4.1.Understanding Ecosystem Services
The ‘ecosystem service’ is relatively new concept. Simply, ecosystem services are the direct and indirect contributions of ecosystems to human well-being (TEEB 2010). As explained in detail in Chapter 3, ecosystems are communities formed by the interaction between living (plants, animals, microbes) and non-living organisms (air, water, mineral soil). The structure and processes of the ecosystems underpin the capacity of an ecosystem to provide goods and services. These services include provisioning services such as clean water, food, raw materials; regulating services such as prevention and reduction of environmental risks such as flooding and erosion, carbon sequestration, biological control, pollination, etc. habitat services and cultural services such recreation, inspiration for culture and art, science and education.(Haines-Young, R. and M. Potschin, 2010). Ecosystem services and their links to human well-being are summarized in Figure 1.
Figure 1. Ecosystem services and their links to human well-being
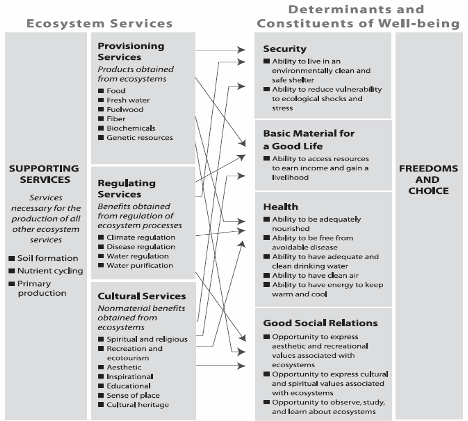
Source: Liu, 2005
To make the links between ecosystems and human wellbeing more clear and for better understanding of the relations, a theoretical model has been developed by Potschin and Haines-Young (2016); Burkhard and Maes (2018) to identify intermediate or supporting ecosystem services, final ecosystem services and goods and benefits. Ecosystem services are thought as an interface between human and nature. This model is described as “the pathway of causal interrelations between ecosystem at one end and the human well-being at another” (Fig. 2). The differences between endpoints and the steps between are aimed to be cleared more in this model.
Figure 2. The cascade model
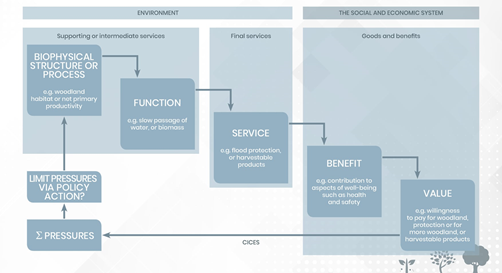
Source: Potschin and Haines-Young, 2016
The “ecosystem” given in this model is characterized by its biophysical structures and processes. Habitat type such as woodland, wetland, grassland etc. are meant by biophysical structure, similarly, dynamics and interactions forming the ecological system are meant by processes (e.g. primary production). The characteristics of the ecosystem that builds its capacity to deliver an ecosystem service is defined as ecosystem functions, in the cascade model. Those elements and features, which determines the ecosystem capacity to deliver services, are sometimes called‘supporting’ or ‘intermediate’ services. Directly contributing services to human well-being; what we actually can harvest (e.g. hey, timber) or gain from ecosystem (e.g. flood protection, beautiful landscape etc.) are ‘final’ ecosystem services as well as health and safety. (Kasparinskis, et al, 2018)
Cascade model might be criticised because of ‘lacking links’, especially not including disbenefits of ecosystem services to complete the picture. Along this line, Rendon et al. (2019) reported that, “The clarification of the linkages between ecosystem services and human well‐being will provide holistic and informed decision‐making through incorporating all relevant stakeholders especially health and social services; direct and indirect drivers of change. They proposed a framework that builds on the UK National Ecosystem Assessment by accounting for the concept of disbenefits in addition to benefits and linking the classification of benefits and disbenefits to their effect on seven human well‐being domains (Figure 3). This framework is beneficial to describe inter-dependencies between services and disbenefits, and also describe trade‐offs* (explained at the end of chapter) with specific impact on human well‐being at a various ratios and for different components.
Figure 3: Conceptual framework with disbenefit
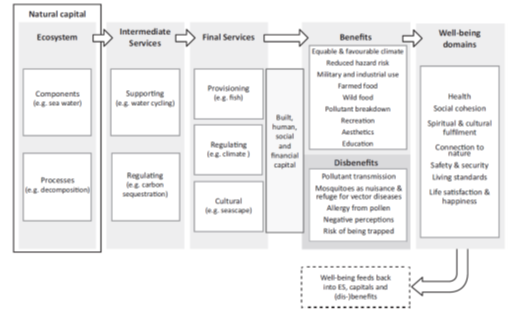
Source: Rendon et al, 2019
Additionally, before finalization of this seciton, we should remember that, humans have reshaped ecosystems as never before. Therefore, to summarize human impacts on ecosystems will be beneficial to see the big picture (Table 1) before classificaiton of the ecosystem services.
Table 1. Pressures and indicators for ecosystem condition assessment
|
Pressures |
Indicators for ecosystem condition assessment |
|
Climate change |
Changes in temperature, humidity, precipitation, fires, extreme events, droughts, floods, storms, sea (surface) temperature, sea level rise |
|
Habitat change |
Land take / sealing, land cover change, land abandonment, fragmentation, dams, river regulation. |
|
Invasive alien species |
Emergence or expansion of invasive alien species, diseases |
|
Land/sea use or exploitation |
Intensification, erosion, (over-) harvesting, deforestation, water extraction, degradation / desertification (over-)fishing, aquaculture, mining, irrigation |
|
Pollution and nutrient enrichment |
Air pollution, soil contamination, water quaity, fertiliser and pesticides application, acid deposition |
Source: EU, 2016, Technical Report
4.2.Classification for Ecosystem Services
Measurement of the benefits and assessment of the ES is highly important. Additionally, what will be measured should be known precisely according to common typology of the ES. Several classifications are used for ecosystem services depending on different criteria such as ecosystem types and scale such as forests, marine areas, wetlands, etc; service flow such as cascade model; type of benefit (private or public) and values (intrinsic or enstrumental).
According to the European Commission Report (2016), there are 3 international classifications (MEA, TEEB and CICES) for ecosystem services. All three classifications include resources, regulatory and cultural services. It was stated by Haines-Young and Potschin (2018) “consistency is also needed when ES are to be defined and categorised; the revised version 5.1 of the Common International Classification of Ecosystem Services (CICES) provides clear guidance. Because it categorise ecosystem services using a five-level hierarchy, with each level being progressively more detailed and specific”. Therefore, CICES built on the existing classifications (MA, TEEB) but focuses on the ecosystem service dimension will be given here. In the CICES system services are either provided by living organisms (biota) or by a combination of living organisms and abiotic processes.
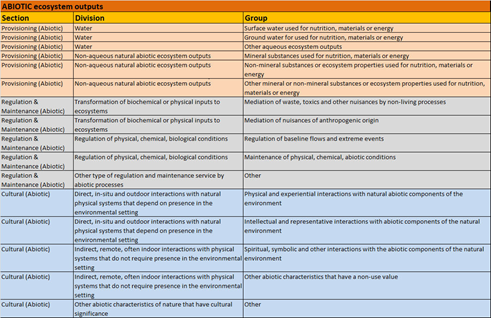
Tables 2 and 3 summarizes CICES (V5.1) for biotic and abiotic ecosystem services respectively for upper three levels in the classification.
Table 2. CICES (V5.1) for biotic ecosystem services
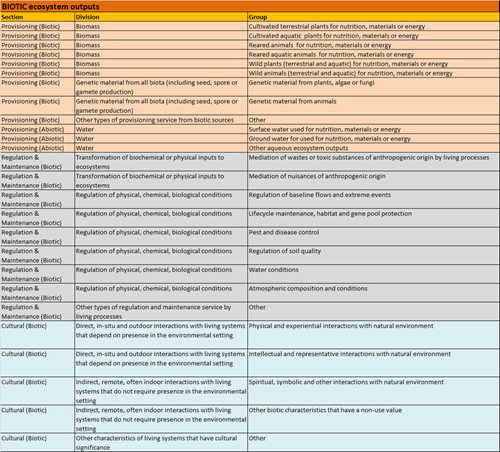
Table 3. CICES (V5.1) for abiotic ecosystem services
4.3.Ecosystem Services Mapping and Assessment
In spite of increasing evidence of the many benefits of ‘nature’s to people’, especially for climate change mitigaiton and adaptation measures; ecosystem degradation and loss of biodiversity still continue on a large scale. Anthropocentric activities are the major cause of loss in biodiversity and modified wildlife at an unprecedented rate. (see Chapter 2). The Millenium Assessment found that more than 60% of ecosystem services are being degraded or transformed in a way that endangering future human well-being (De Groot, et al, 2018). Therefore it is increasingly becoming important to analyse and quantify the linkages between human activities and ecosystem services for better understanding of the potential implications of ecosystem changes thruough standardised, transparent, and eventually certified way. Mapping ecosystem services helps people to understand the full spectrum of ways in which the natural environment contributes to people's well being. Similarly, ecosystem services assessment is essential to make informed decisions for rational use and management of natural resources. In turn, this information will improve the environmental analysis and review process and help avoid, minimize, and mitigate possible anthropogenic impacts. Appropriate and objective ES assessment is the most effective way and useful form of evaluation to provide development towards sustainable social-ecological systems.
In this respect, after the adoption of the EU Biodiversity Strategy 2020, ES mapping and assessment have gained priority on the agenda of all EU countries. The strategy intends to prevent the loss of biodiversity and destruction of ecosystem services and improving them as far as feasible in the EU by 2020.
Thus, to know where and how, for example, food, water, clean air, other materials and recreation are provided and how climate, nutrients, natural disasters, pests and diseases are regulated, appropriate methods, information and data are needed. Santos-Martín (2019) mentioned that; “information and data on actual ES demands, beneficiaries and potential mismatches with their supply location as well as ES quality and quantity are essential to make informed decisions for appropriate management of natural resources”.
To this aim, a broad array of guidelines- over 80 tools- have been developed and applied to map and assess ecosystem services in line with Action 5 of the EU Biodiversity Strategy. Common main structure required to guide ecosystem assessment are;
- (i) Mapping of ecosystems; Only if the ecosystem services are mapped and their spatial distribution is known, we will be able to understand this complex system
- (ii) Describing the state of the ecosystem;
- (iii) Quantification of the ecosystem services;
- (iv) Gathering all these into an integrated ecosystem assessment. (Burkhard et al, 2018)
Although all these guidelines have common structure, it is not easy to decide which tool is the most appropriate to be used for which assessment step and under which circumstances. Harmonising the wide range of methods for mapping and assessing ecosystem services (ES) has been accepted as an important step in providing quantitative and comprehensive information on the status and trends of ecosystems and their services. (Vihervaara et al, 2019). The factors that could be taken into account in order to find the most suitable methodology among existing ES mapping and assessment approaches are related to the details of analyses needed, the purpose of the study and data and resources availability.
Mainly, three major dimensions of ES mapping and assessment could be classified as; biophysical, economic and socio-cultural dimensions. Biophysical units are used to quantify, in particular, the measurement of ecosystem structures, processes, functions and service flows like quantities of wa¬ter abstracted from a lake, area of forest or stocks of carbon in the soil in biophysical methods. Hydrological and ecological models, production functions based on the analysis of structural and functional traits of ecosystems, or on biophysical modelling are used in this method. Economic quantification of ES attempts to measure the human welfare derived from the use or consumption of ES. ES values are expresses in terms of monetary units (e.g., market prices, replacement cost, hedonic pricing). Burkhard and Maes (2017) stated that, “economic quantification or valuation is one way to assess and communicate the importance of ES to decision-makers and can be used in combination with other forms of informa¬tion”. Although ES assessments mostly focused on ecological and economic valuations until recently, as Pascual et al. stated (2017), “socio-cultural dimension has strongly gained in importance over the past 5 years, since value pluralism was again emphasised as an important goal in ecosystem service assessments”. Socio-cultural dimension of ES assessment aims to identify values attributed by humanbeings to nature; intrinsic, extrinsic or instrumental values that is particularly suitable for capturing perceptions assigned by people to ES. It helps to increase our understanding of how important ES are to people (Walz et al. 2019). There may not be certain distinction between social pereference and monetary values assessments, methods to investigate social preference can be used to assign monetary values. In this situaiton experts from different disciplinary backgrounds take part and use variety of methods from different disciplinary backgrounds for ES assessments.
However, any evaluation of ES requires an integrat¬ed analysis, taking into account biophysical, socio-cultural and economic value dimen¬sions together. That means, not only integration of various biophysical components, but also methods to map and assess social and economic values for different ES. Integrated modelling frameworks will be beneficial for end-users in ES assessment and enable decision-makers to assess quantified trade-offs associated with alternative management choices and to identify areas where investment in natural capital can enhance human development and conservation.
Along this line; integrated methodology of ES mapping and assessment will be discussed in this chapter. The MAES (initiative on Mapping and Assessment of Ecosystems and their Services) conceptual model that is central to the EU Biodiversity Strategy to 2020, based on the provision of ES, will be explained as an example to integrated assessment model.
European Commission’s MAES approach provides a nine-steps including the identification of related questions or problems to be defined, characterization and mapping of ecosystem types, current situation of ecosystem and ecosystem services, their integration and dissemination of results.
The operational framework for integrated MAES approach is composed of nine consecutive steps as given in Figure 4.
- Step 1: Question and identification of problem;
- Step 2: Identification of ecosystem types;
- Step 3: Mapping of ecosystem types;
- Step 4: Characterisation of ecosystems and ES provided by ecosystems;
- Step 5: Selecting indicators for ecosystem condition and ES;
- Step 6: State of ecosystems and ES indicator measurements;
- Step 7: Mapping current state of ecosystems and ES;
- Step 8: Integration of the results;
- Step 9: Communicaiton and announcement of results.
Figure 4. Framework for integrated Mapping and Assessment of Ecosystems and their Services
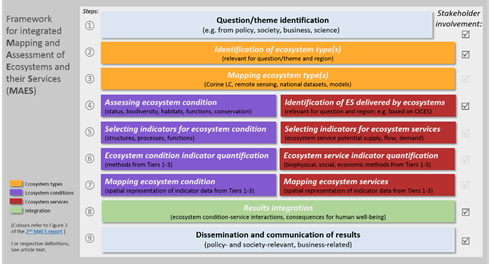
Source: MAES
The presented framework provides a linear step-wise structure that facilitates the development of respective studies, starting from relevant questions to be answered and leading to the communication of integrated results. ES are truly transdisciplinary field of research and application and the involvement of stakeholders is mandatory if the assessment is to be successful. As authors (Burkhard et al, 2018) mentioned, “this method provides an easy-to-comprehend and applicable multitiered approach, considering different ES quantification and mapping methods (biophysical, social-cultural and economic) that can be applied according to specific needs, data and resources availability”.
Since such a linear approach may not cover all aspects such as interrelations and feedbacks in complex social-ecological systems; another conceptual ecosystem assessment framework aimed at delivering a ‘flexible methodology’ to assist MAES, will be introduced in this chapter too. The distinctive character of this framework is to provide a flexible approach in terms of its application so that users can select, and integrate, only those activities most appropriate to their needs. The framework can provide guidance to practitioners as to the distinct elements and/or activities they will integrate, depending on their needs.
As can ce seen from Figue 5, the green box proposes different types of inter-relations among parts of the ecosystem assessment that are beneficial for specialists. This will enable the characterisation of trade-offs, synergies and consequences for human well-being. Specialists can use the framework to identify where they need to integrate different elements. This 'flexible methodology' could be used to choose and apply convenient combinations of methods for ES mapping and evaluation under spesific conditions (e.g.time requirement, experience, specialization, avaiability of data, scale) and for specific contexts and purposes. By using such a framework, experts are supported to think through which activities are required to address the policy-relevant questions and to identify where integration will take place, ultimately leading to an assessment that meets the needs of policy-makers.
Brown et al. (2018) said that “it's essential when designing an ecosystem assessment to think about how and where the concepts of integration are going to be considered to deal with policy-relevant questions. While assessment processes aren't well documented or evaluated, anecdotal evidence suggests that integration through the governance structure (inclusion of stakeholders), combining of various data sources and therefore the use of appropriate tools allows for greater impact of the ecosystem assessment within decision-making”.
Figure 5. The Integrated Ecosystem Service Assessment Framework
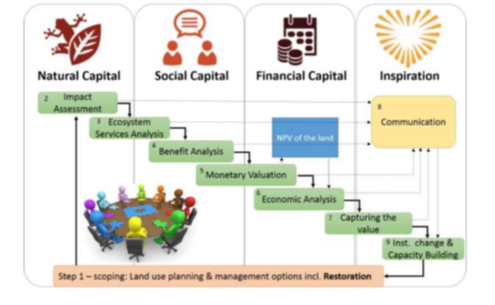
This method also figure out and includes the benefits of landscape restoration, nature conservation and sustainable land use. It contributes the understanding integrated direct and indirect effects on human wellbeing.
The framework consist of 9 steps as briefly explained below:
- 1) Scoping: Before starting an assessment, the scope, context and purpose of the assessment should be made clear, in close consultation with the most relevant stakeholders, to avoid collecting unnecessary data or forgetting important aspects.
- 2) Impact Assessment: This step involves assessing the direct impacts (positive and negative) of restoration, or other intervention in the landscape, on ecosystem structure and processes as well as the secondary effects in terms of changes in the functioning of the landscape (i.e. the (carrying) capacity of the landscape to provide services) compared to the baseline (e.g. loss of vegetation leading to erosion and loss of productive capacity).
- 3) Ecosystem Services analysis: Effect of restoration or other intervention on changes in actual, and potential, use of specific ecosystem services.
- 4) Benefit analysis: Changes in ES as analysed in Step 3 will have effect (positive or negative) on health, livelihood, cultural identity, and other wellbeing (social & human-capital) indicators (e.g. jobs, education, security, social-cohesion). In this step these benefits are quantified in non-monetary terms.
- 5) Monetary valuation: Once the effects of land use change (e.g. restoration) on ecosystem services (step 3) and benefits (step 4) are understood and preferably quantified, monetary effects could be analysed by tusing direct market values, indirect market values and non-market values to determine changes in Total Economic Value of the bundle of ES provided by the restoration activities.
- 6) Economic analysis: This step investigates the implications of ecosystem restoration for the local/regional/national economy in terms of economic indicators, e.g. employment, increased tax revenues, corporate profits, return to investors, etc. Also the change (usually increase) in value (NPV) of the land (see step 5) should be part of the economic analysis.
- 7) Capturing the value: Based on step 5 and 6, which together provide information on the return of financial capital, incentives (financial or otherwise) can be developed to invest in ecosystem restoration and/or sustainable management.
- 8) Communicating the value (and benefits) to generate awareness and support (‘inspiration’) for the measures needed to implement the incentives, communication activities can be employed after any of the steps (e.g. simply providing information on the return of ecosystem services (step 3) and their benefits (step 4) might be enough to move to step 9 (changing institutions and behaviour) without having to go through the more complicated and time-consuming efforts to calculate monetary (step 5) and economic (step 6) effects.
- 9) Capacity building and institutional change: To ensure implementation of the outcome of the assessment in long term policy, institutional and management changes at relevant scale levels (eg. ranging from local capacity building programs to national policies and institutions) are needed.
For a comprehensive assessment of the effects of restoration (or other interventions in the landscape) ideally all 9 steps should be included. Depending on the situation (available data, time and funding) and required level of detail this can be done in just a few months or may take several years (especially if it includes long-term monitoring and establishing societal change). It should also be noted that there is some overlap between steps, and in practice some steps can, and should be performed simultaneously. Also, not all assessments will be able (or require) to perform all steps in the same detail depending on the aim and context of the assessment (De Groot et al, 2018).
Finally, it could be concluded that, above integrated and flexible ecological-economic and systems perspective to ecosystem services assessment is important to investigate the interplay between ecological and socio-economic systems. This will allow a deeper and all-inclusive understanding of the contribution of the ecosystems and the costs due to their uses.
Although ES mapping methods and technologies are improved, there are several challenges for map producers and map users because of complexity of the process and how to transfer mapping info into policies. Paloma et al (2018) classify seven mapping bottlenecks faced by the experts as:
- i) interaction between map-maker and map-user;
- ii) codification and ontologies;
- iii) qualified personnel;
- iv) data availability and map availability
- v) selection of appropriate method;
- vi) technical inadeqaucies;
- vii) under estimation of mapping process/output
Humans are the inseperable part of web life which is complex, interconnected system. Each component plays an important role in this system. Even a small change or removal of any component, the entire system is affected, and this can produce positive or negative consequences.
4.4.The Role of “Ecosystem Service Concept” in Environmental Policy Development
Since ecosystem services represent integrated holistic view on human-nature relationships; deserves to be acknowledged as important framework for policy and decision making. ES have the potential to become a major tool for policy and decision making on global, national, regional and local scales. Results of the ES mapping and assessment might be leading documents for policy development in several areas; from sustainable management of natural resources, environmental protection and nature conservation, land use planning, climate protection, disaster risk reduction to environmental training and research activities. The ES concept can serve as a communication tool to engage the science–policy–society interface (Díaz et al. 2015, Everard 2015, Bull et al. 2016).
ES have potential to address conflicts, dilemmas and synergies between environmental, economic and social objectives. Such integrative approach requires systematic thinking and understanding of the complex relations and feedback mechanisms in social-ecological systems for providing integrated measures (Liu et al., 2015).
As Maes et al. (2012) stated “policy makers have realised that ecosystem services or nature based solutions (e.g. using wetlands for water purification or flood prevention) might be more cost efficient than technical infrastructures”. Moreover, as Fürst et al. (2017) mentioned “ES concept can provide a comprehensive framework for trade-off analysis, addressing compromises between competing land uses and help to facilitate planning and development decisions across sectors, scales and administrative boundaries”.
Figure 6 indicates clearly; policy areas that can be benefited from ES and their assessment are not only biodiversity objectives as stated in Action 5 of the EU Biodiversity Strategy 2020, but also other environmental policies, including climate change, sustainable agriculture, water, marine, forestry as well as regional policies.
Figure 6. Applying of the EU Biodiversity Strategy 2020 Action 5 outputs in different policy sectors
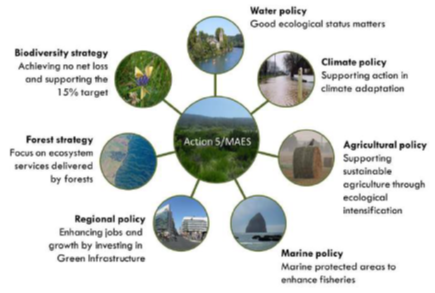
Source: Maes et al., 2014
Ecosystem service mapping and assessment results can contribute to environmental policy in relation to assessment of risks and impacts to ecosystem and/or human health from different human activities as well as planning various mitigation or management measures.
4.5.Ecosystem Services for Pandemies
Biodiversity plays very important role and crucial for the sustainability of ES. The emergence of COVID-19 has accentuate with the loss of biodiversity, and the destruction of the system that supports human life. The more rich in biodiversity means, the more difficult for pathogens to spread out. Adversely, loss in biodiversity increase opportunity for zoonotic disesases; pathogens to pass between animals and people.
Anthropogenic impacts, including deforestation, extensive agriculture, encroachment on wildlife habitats, and climate change, have destroyed the sensitive balance of the ecosystems. As humanbeings, we increased our pressure on the ecosystems that serve us several benefits mentioned at the beginning of this chapter and have created conditions in wihich particular pathogens–including coronaviruses to spread. Zoonotic account for seventy-five percent of all emerging infectious diseases.
This can happen via various mechanisms as given by WWF, (2020)
- Increased breeding sites for disease vectors, such as irrigation channels and dams where mosquitoes proliferate
- Increased spread of host species
- Keeping wild species captive in close contact with each other, and with domestic animals
- Transfer of pathogens between different species
- Loss of predatory species
- Human-induced genetic changes in disease vectors or pathogens (such as the resistance of mosquitoes to pesticides or the use of drugs in intensive livestock farming leading to the appearance of bacteria resistant to antibiotics)
- Environmental contamination by infectious disease agents”.
To prevent future outbreaks, threats to ecosystems and wildlife, including habitat loss, pollution and climate change should be taken into account. Because, change in land-use patterns especially deforestation and the alteration of natural habitats, are responsible for almost half of the zoonatic disesaes emerged.
“COVID-19 allowed us to review our relationship with nature and warn us to adapt for new green deal and more environmentally responsible planet. Emergence of zoonotic diseasse is caused by impact of human activities. As the World population reaches to 9 billion, better understanding of the web of life in which we live and appreciate that it functions as a whole system is a must. After reviewing our relationship with nature, we must keep it at the forefront in decision making.”
Useful Definitions
Specific concepts to examine how different ecosystem services are interconnected are:
Trade-offs are commonly defined as an increase in one ecosystem service resulting in a reduction in another. For example, felling a forest to cultivate crops contributes to and increases food provision but reduces other benefits coming from the forest’s existence, such as carbon storage, air quality and flood regulation. Thus it is common to say that one ecosystem service is ‘traded off’ against others.
Synergies are a good example of ecosystem service interconnections. They occur where increases in one ecosystem service are coupled with increases in another. This happens in several situations, e.g. when the regulating service pollination contributes to increasing the provisioning service crop production. Another example is the synergy between soil erosion control and crop production. Usually erosion results in a loss of the more fertile soil, reducing yields. The control and mitigation of erosion phenomena means maintaining soil productivity and thus ensuring a better supply of crops (provision). Measures to prevent soil erosion might address additional synergies when, for example, they involve planting or protecting vegetation along river banks, which can in turn boost water purification (regulating) and might create a pleasant landscape for tourism (cultural).
An ecosystem service bundle, or cluster, is defined as a “set of ecosystem services that repeatedly occur together across space or time”. A simple example is given by forests which provide timber (provision) carbon sequestration (regulation) and the possibility of pursuing outdoor activities (cultural). It will be interesting to find out how many ecosystem service bundles are present in the Alps.
So, understanding trade-offs and synergies among ecosystem services is the paramount aspect of decision making in territorial development and environmental management, in order to reduce the damaging effects of focusing on a few services at the expense of others.